Understand which aspects of a business process drive suboptimal performance, for any given metric or KPI
Process excellence includes both the dimensions of quality and effort: Business process results must first of all meet client requirements, and then, as dictated by economics, companies must strive to achieve these results as efficiently as possible. To optimize efficiency, three questions need to be answered: Which are the pockets of inefficiency for a given business process, how large and costly are they, and can they be addressed in a structured manner?


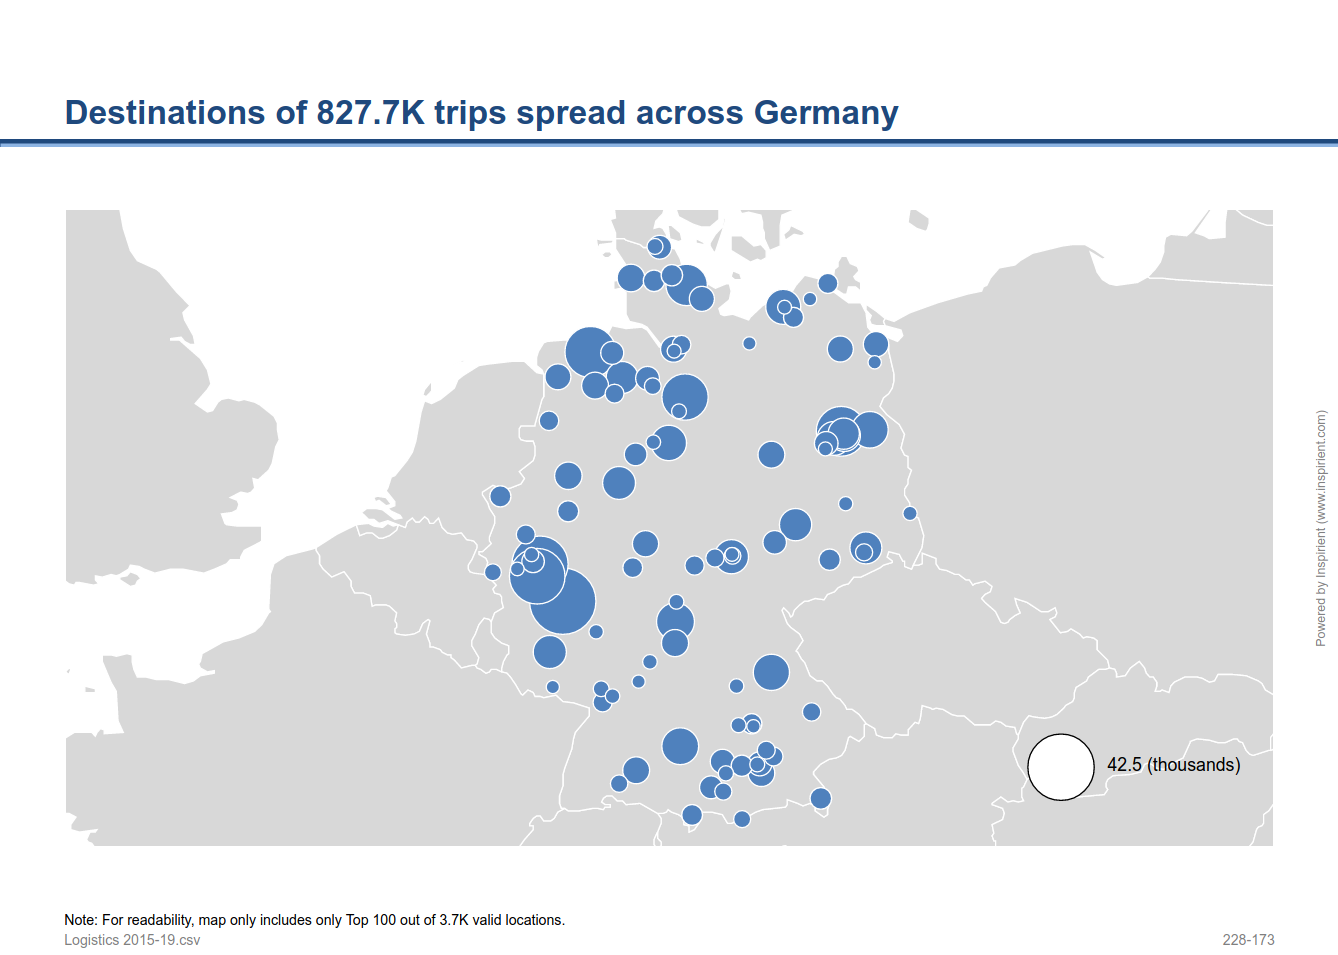
For example, a company may decide to optimize its logistics operations and thus ask the question whether there are cost cutting opportunities in long-distance trips. Somewhat simplified, the distance traveled by company vehicles is identified as a key cost metric. Evaluating this KPI, it becomes apparent that certain trips, i.e., certain instances of the process, are suboptimal and cover vastly larger distances than others.
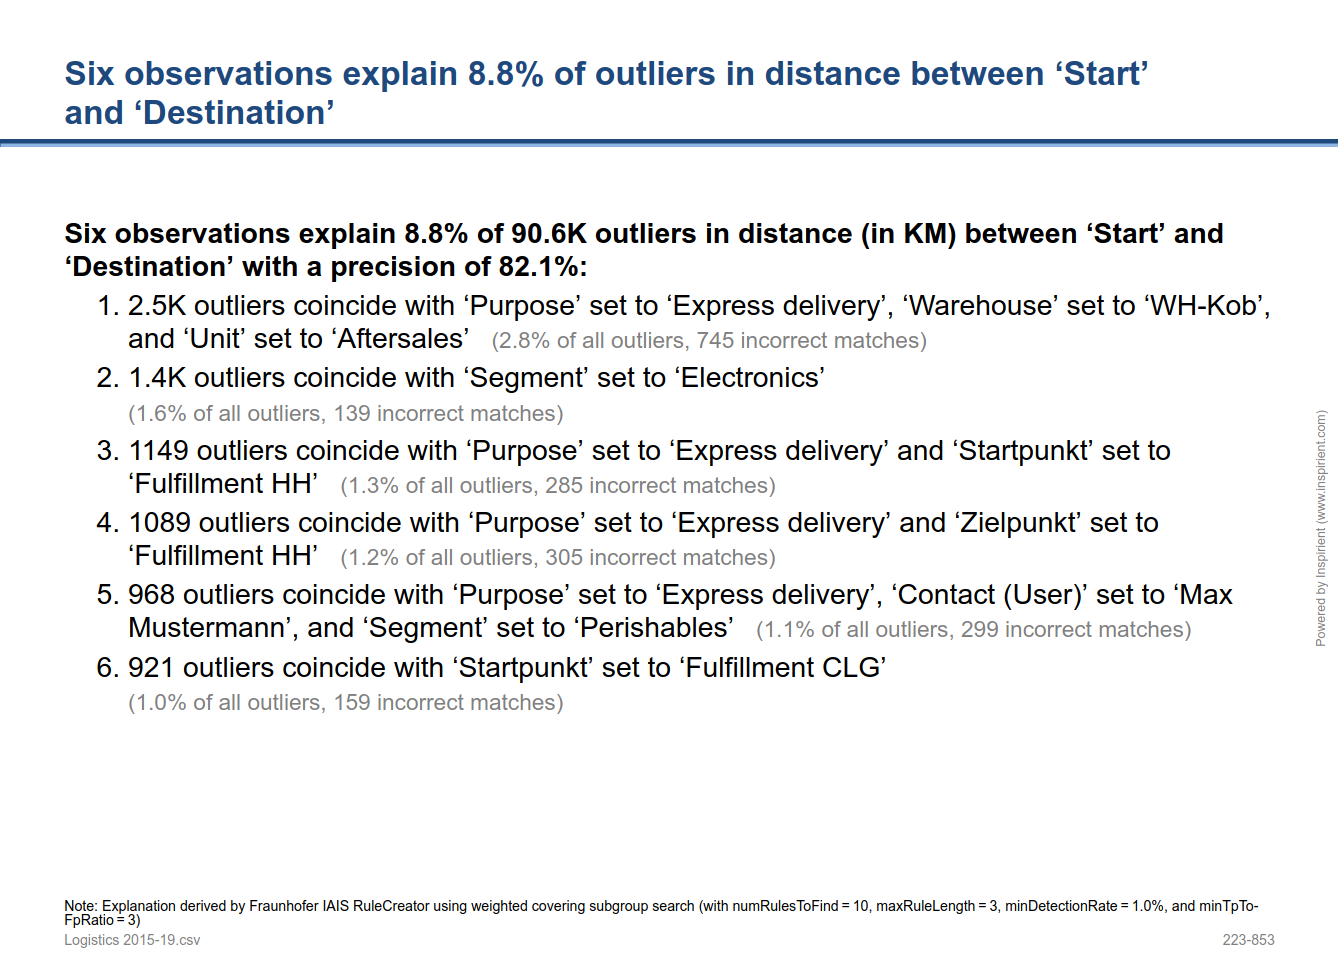
It is of course not practical to optimize the overall process by tackling each suboptimal instance individually. Instead, businesses need to understand whether there are key drivers shared across many outliers. Analytically, this can be achieved by employing the Fraunhofer IAIS RuleCreator, which surfaces root causes of suboptimal process instances through weighted covering subgroup search. Inspirient can then process these root causes into easy-to-understand observations that businesses can prioritize and act upon.

While this example is focused on logistics – and as a result highlights groups of long-distance trips based on source, distance, and purpose – the key takeaway is that this optimization method is generally applicable to any business process for which suboptimal behavior can be identified via a KPI. In the simplest cases, this KPI could be the execution time of the process, e.g., for back office operations, or any cost-related metric such as unit contribution margin.
The Inspirient Automated Analytics Engine automates the entire data analytics process end-to-end: From the assignment of input data, pattern and outlier detection, automated visualization of patterns, weak points and opportunities to automatic generation of textual explanations and recognition of the underlying relationships and rules. Most other analytics solutions rarely include these textual explanations and observations regarding the underlying data relations, which are both critical to provide a deeper level of analysis and more actionable conclusions.
